
Your plant’s data, straight from the PLC to the people who operate and manage.
CRONOS reads the controllers already on the shop floor, stores every variable with a timestamp and, at the end of each shift, delivers the finished report by e-mail. No spreadsheets, no copying numbers off a screen.
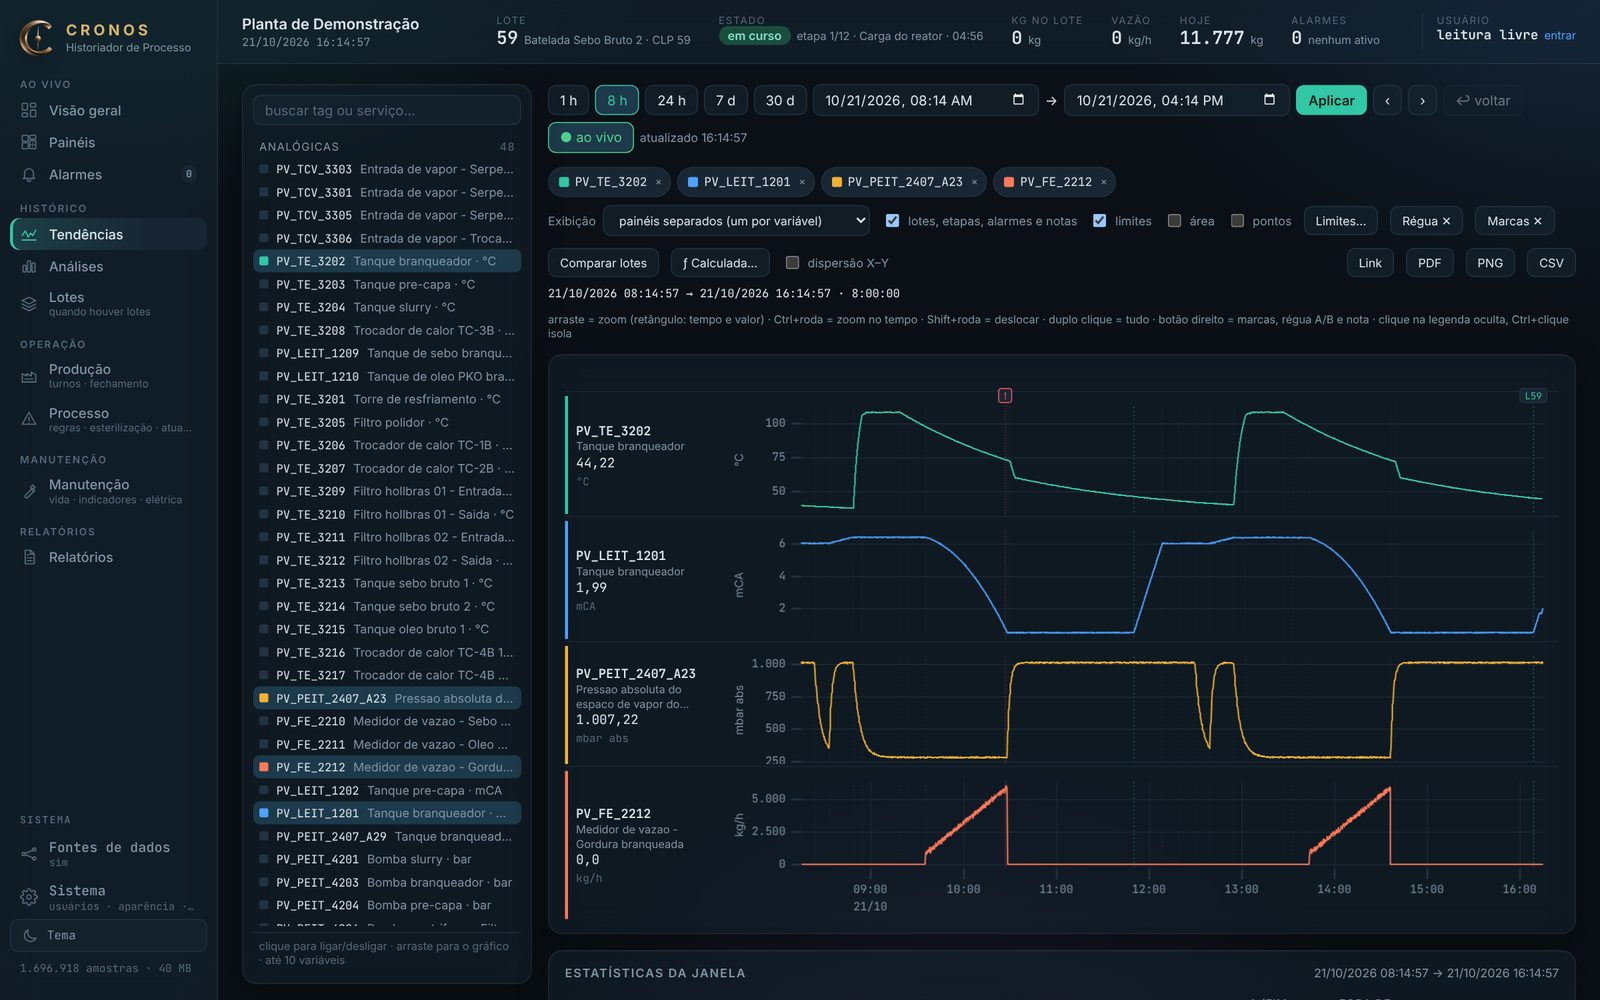
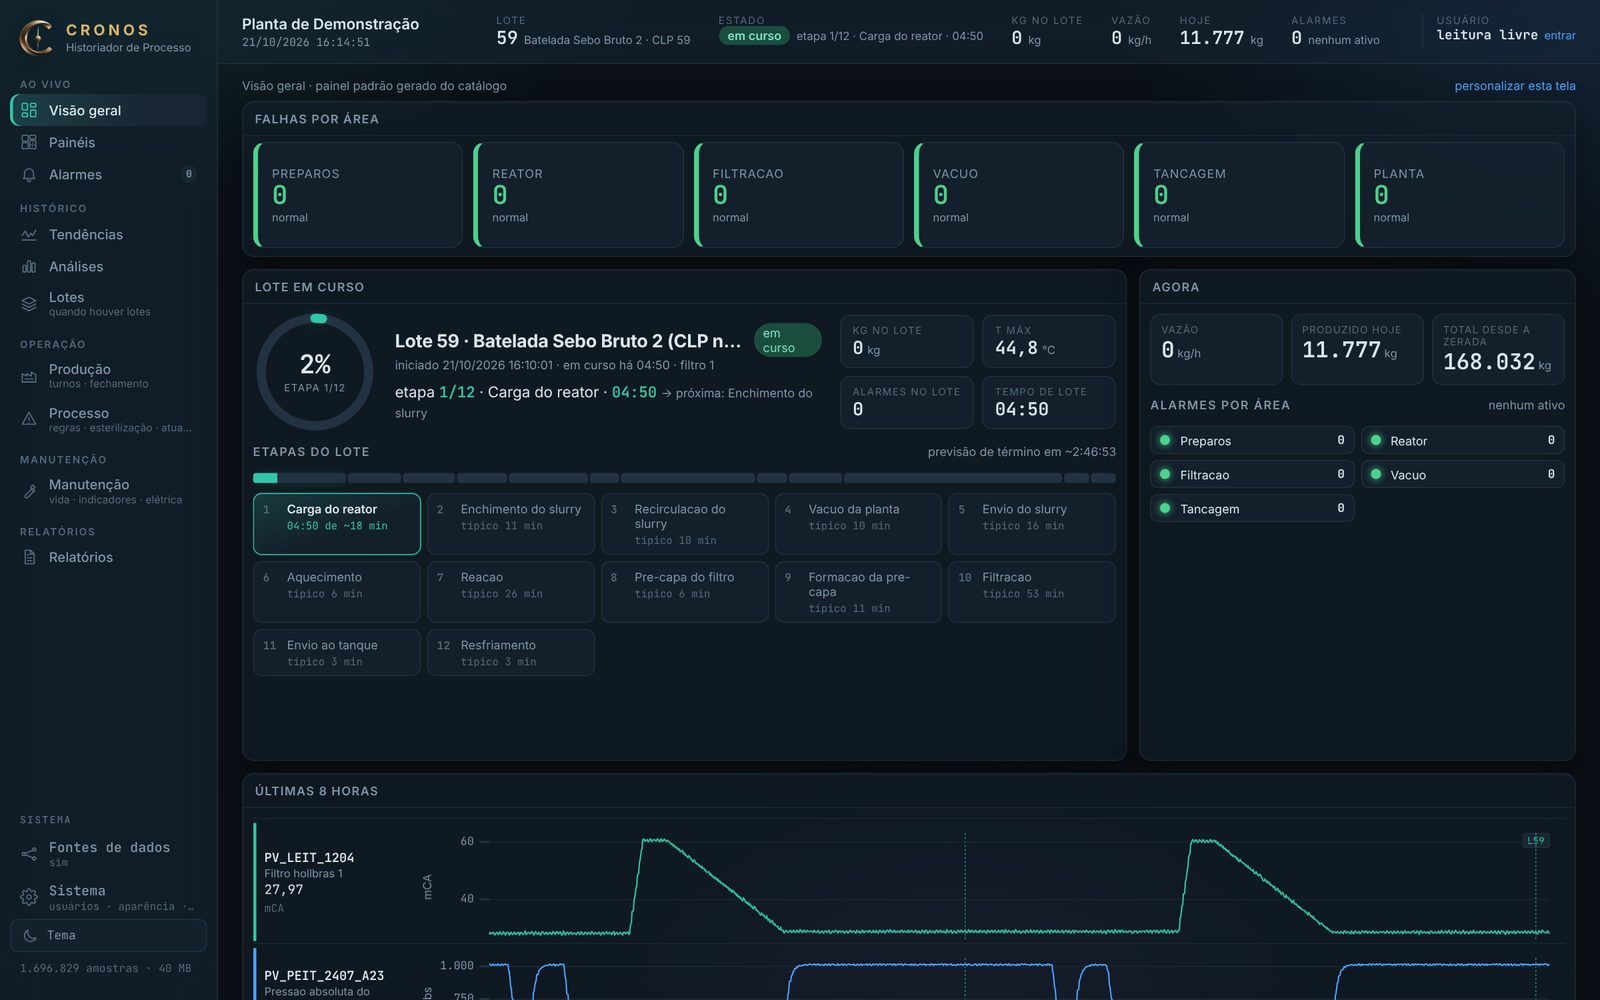
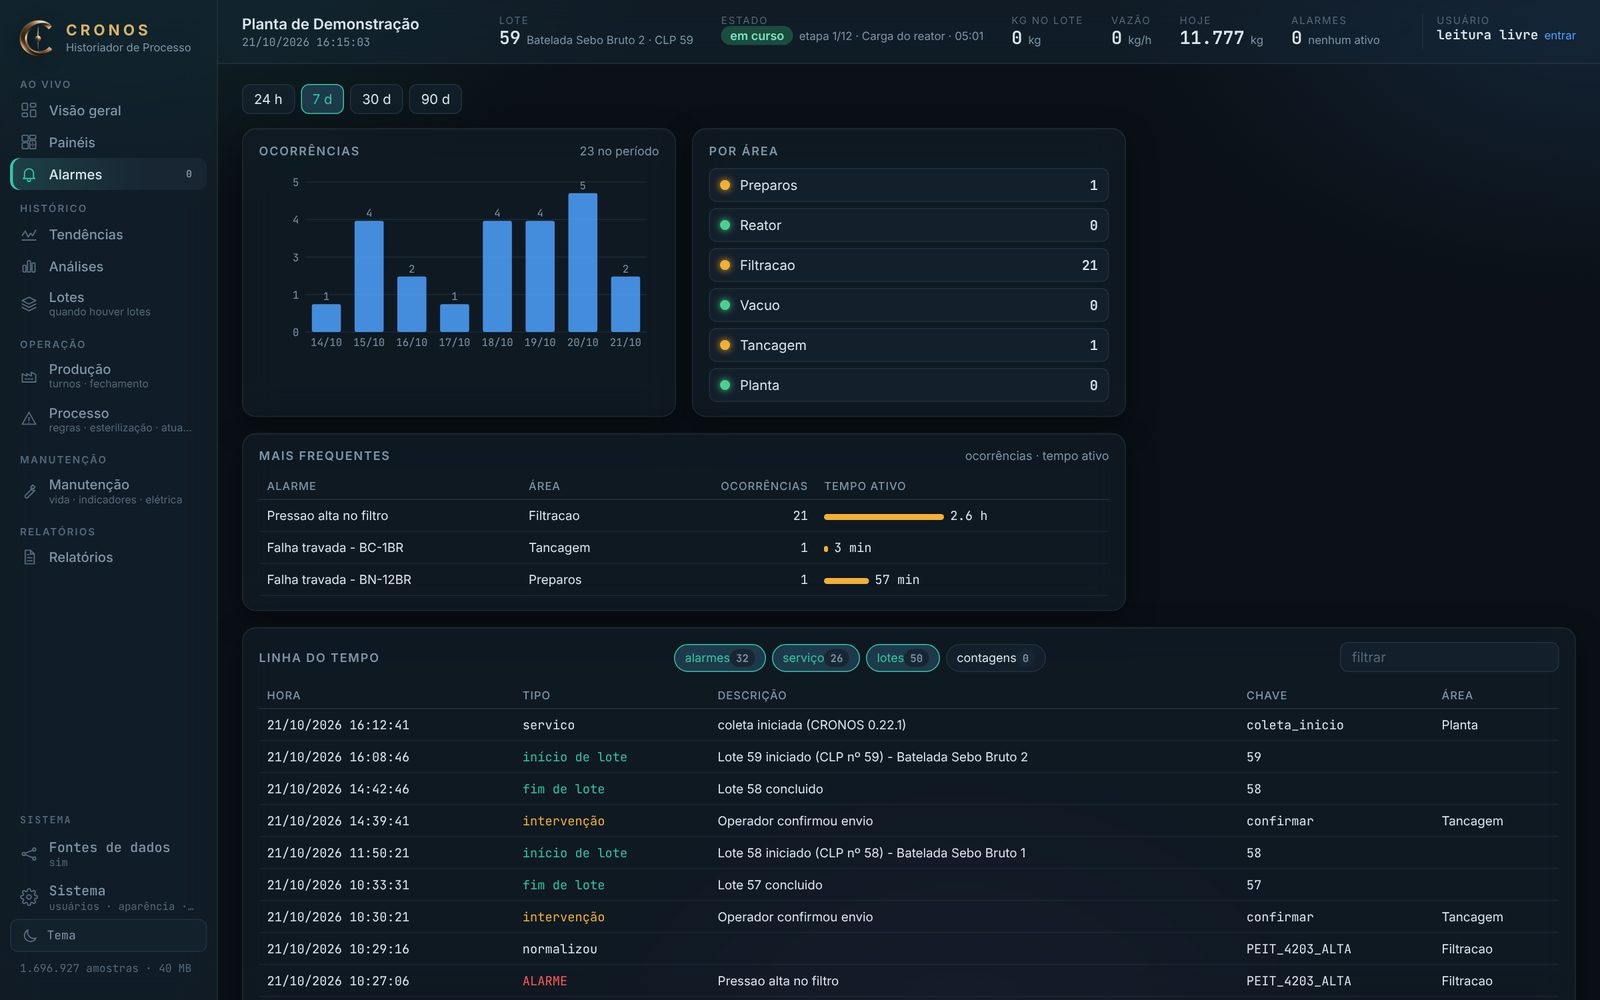
One system, from the PLC read to the manager’s inbox
Built for plants that are already running: nothing is written to the controller and nothing requires stopping production to install.
Direct PLC acquisition
Several controllers and protocols at once. Watches each connection and alerts when a device stops responding.
History and trends
Every variable timestamped and comparable with any other. Zoom, cursor, window statistics, CSV and PNG export.
Batches and production
Batches with steps and durations, or counter-based production in continuous plants: cycles, transfers, tonnes per shift and yield.
Automatic reports
Shift reports, dashboards as PDF, daily closing and operations analysis. Generated on schedule and sent by e-mail.
Maintenance by actual use
Hours under load, starts, faults and stops per asset. Plans by cycle, by condition and by date, with work orders.
Energy and process
Meters and breakers in the same history: kWh per tonne, demand, energy without production. Process rules with alerts.
From the plant floor to the engineering table
The same data, no rework, in four places: collected at the PLC, followed in the control room, analysed by engineering and closed in the management report.
The period’s curves, as PDF, in the inbox of those who decide
Any dashboard built on screen becomes a report: each asset’s trend over the period, with scale, unit and time. Generated on schedule — end of shift, production day, week — and e-mailed to the list the plant defines.
- Numbered, archived, every issue kept.
- Period, batch, maintenance or analysis: same engine, your plant’s content.
- Says when it cannot vouch: stretches without data are marked in the report itself.
- When the question is about now, the screen exports CSV, PNG and PDF.
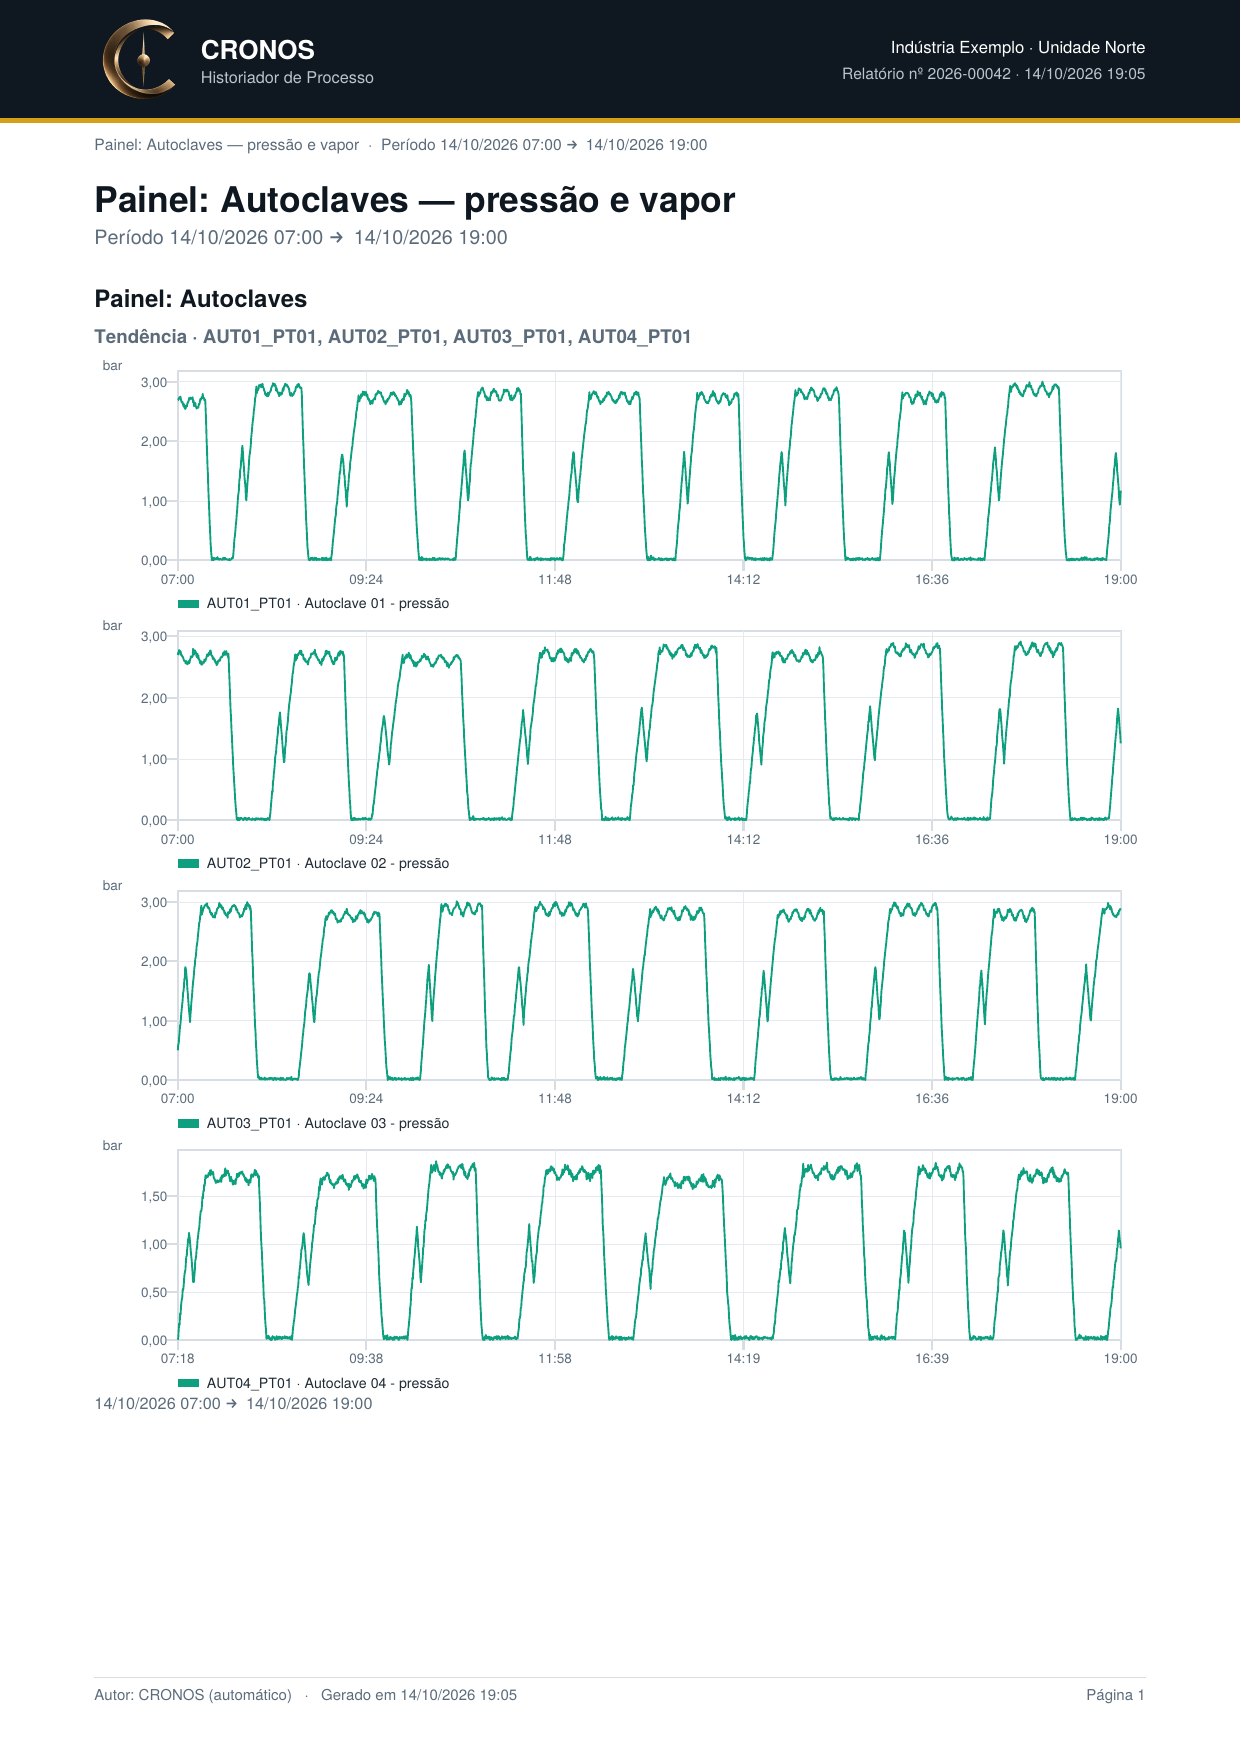
Example with fictitious data: autoclave dashboard of an illustrative unit. Each report’s content is defined by the plant.
Three steps, none of them touches your PLC
Connects to the controllers already there: Siemens, Schneider, Rockwell, Beckhoff, WEG, ABB, meters and drives. Read only.
Pressure, temperature, current, state and counters, stored on every change. Batches, steps, alarms and interventions stay tied to the time they happened.
Trends, alarms and dashboards in the control room; shift reports, daily closing and KPIs in the manager’s inbox. On the phone too, over VPN.
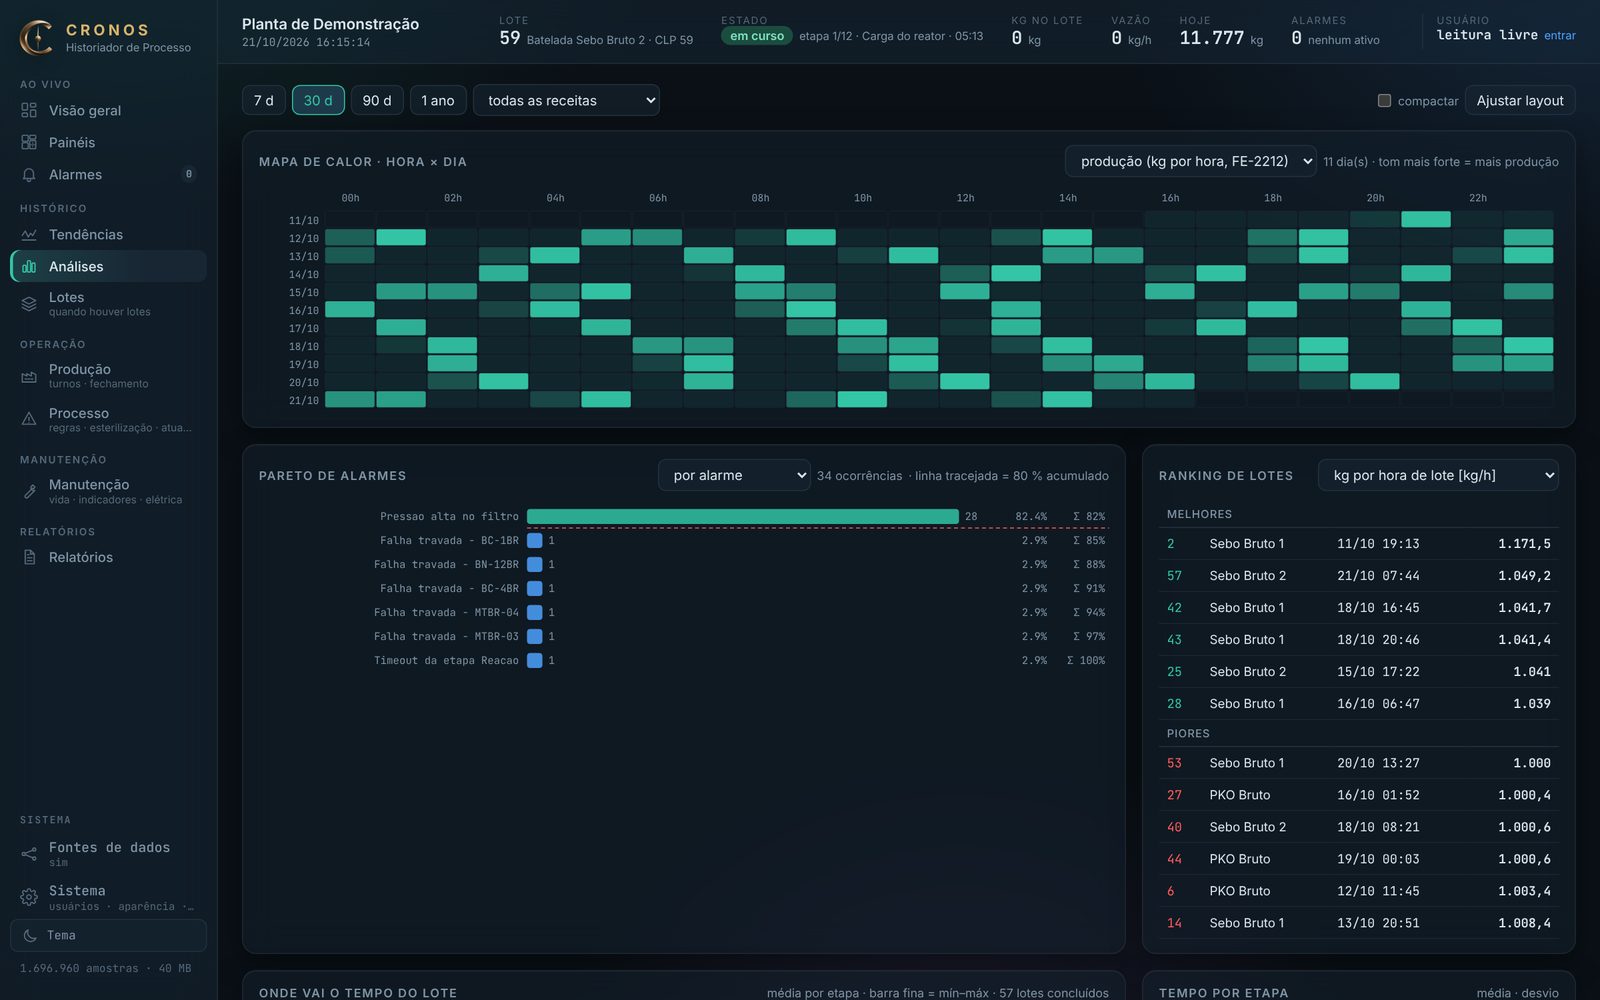
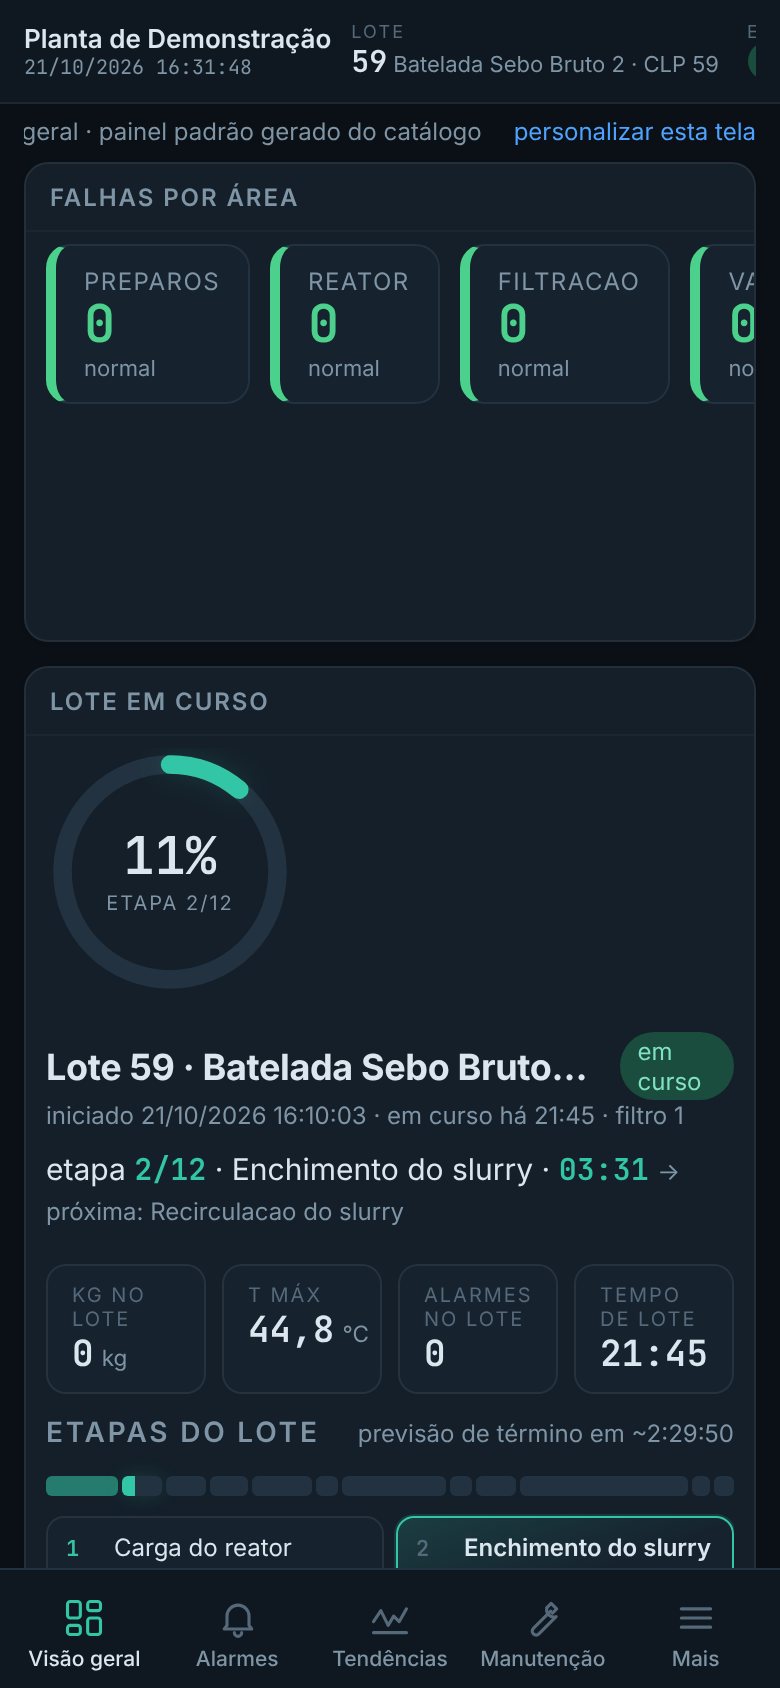
From the control-room wall to the supervisor’s phone
The same web interface, nothing to install on the client. About half a megabyte on first load, designed for the plant VPN.
Wherever there is a PLC and a shift to close
Continuous or batch, new plant or thirty years old: CRONOS reads what the controller already has.
Vegetable oils and agro-industry
Sterilisation, pressing, extraction: batches, pressure and steam per vessel.
Food and beverage
Cooking, pasteurisation, CIP: time and temperature of every batch, with evidence.
Chemicals and water
Reactors, dosing, pumps: recipe followed, consumption per m³, alarms by area.
Utilities, steam and energy
Boilers, compressors, meters: kWh and steam per tonne, demand, energy without production.
Pulp, paper and wood
Dryers, presses, bleaching: hours under load, current, stops per asset.
Mining and materials
Grinding, conveyors, screens: tonnes per shift, vibration and drive current.
Continuous and batch plants
Oil extraction, food, chemicals, water, steam and power. Wherever there is a PLC and a shift to close, CRONOS fits.
Operations
Sees what is happening now and what happened at handover, without relying on the memory of whoever left.
Management
Gets the closed shift on the phone, with the same numbers engineering uses.
Maintenance
Hours under load per asset, faults, stops and component life from what the PLC already measures.
Engineering
Open database, CSV, JSON API for ERP and BI, and ready-made analyses: Pareto, ranking, scatter.